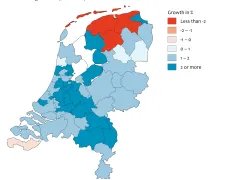
Accessibility, defined as the distance between place of residence and place of work, has improved marginally over the past decade, but the average speed of cars and trains has decreased marginally. More locations are easily accessible by public transport, but population and employment have risen most rapidly in locations situated in the vicinity of motorways. The quality of life appears to have improved, but flood protection does not meet the standards.
The editors have selected the most important indicators. Together, they provide a picture of the current state of spatial developments.
Vernieuwd
Regional economic growth, 2014
Indicator | 29 June 2016Excluding the sector mineral extraction, the Dutch economy grew 1.6 percent in 2014, following two years of contraction. Economic growth including mineral extraction was only 1.0... more
Employment and the live/work ratio by municipality, 2013
Indicator | 5 February 2016In 2013, almost 17% of all the jobs in the Netherlands were located in the four major cities. Relatively more people worked than lived in urban areas.
Vacancy of office space, 1991-2015
Indicator | 19 January 2016In the Netherlands, there is an oversupply of office space. On average, more than 17% of office space is unoccupied in 2015 and the percentage is still growing. There are regional... more
Vacancy of retail space, 2004-2015
Indicator | 19 January 2016There is an oversupply of retail shops in the Netherlands. On average, more than 9% of total shop floor area is unoccupied in 2015. The percentage has been on the rise since 2008, but... more
Ownership of housing stock, 2006-2014
Indicator | 24 December 2015On 1 January 2014, there were 7.5 million houses in the Netherlands. This represents an increase of 7.1% compared with 1 January 2006. Since 2006 a slight increase was seen in... more
