Indicators

The indicators in the Environmental Data Compendium are updated regularly. Below is the list of the last updated indicators. Using this page, you can easily see which indicators were updated since your last visit.
36 indicators found
Show filters
Filter by topic
Filter by period

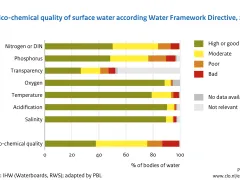
Water quality surface water WFD, 2024

Most water bodies do not meet the quality requirements as laid down in the European Water Framework Directive (WFD). The chemical quality is in most water bodies insufficient. The ecological quality…

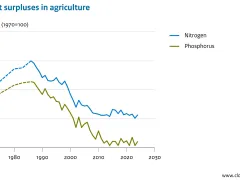
Manure surpluses in agriculture, 1970-2024

Between 1970 and 2024, the nitrogen surplus in agriculture has fallen by about 43 percent. The surplus did not change much in the last ten years and we see a small decreasing undulating trend…

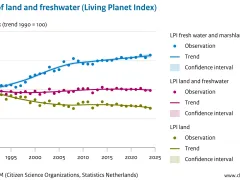
Trend fauna - all species monitored - Living Planet Index Netherlands, 1990-2024

The Living Planet Index of the Netherlands hardly changed since 1990. Species of aquatic and marshland habitats have increased considerably, whereas terrestrial species decreased in the past decades…

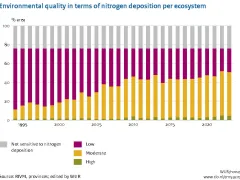
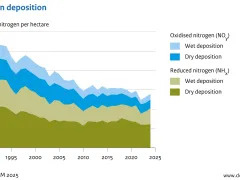
Environmental quality of terrestrial ecosystems: nitrogen deposition, 1994–2023

Nitrogen deposition has declined since the 1990s, leading to an improvement in the environmental quality of terrestrial ecosystems. This improvement in environmental quality stalled in 2010 and from…

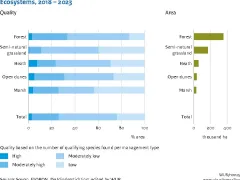
Ecosystem quality (area), 2012-2023

Just over 25% of the area of terrestrial ecosystems has a moderately high to high ecosystem quality, in terms of the presence of species of breeding birds and butterflies indicative of the quality of…

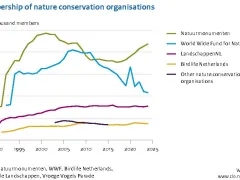
Membership of Dutch private nature conservation organisations, 1989-2024

The combined membership of the four biggest nature conservation organisations in 2024 was 1,760,372 members and donors. Most were members of Natuurmonumenten, which with 874,154 members was the…

Nitrogen deposition, 1990-2024

In 2023, the average nitrogen deposition across the Netherlands was approximately 1,315 moles of nitrogen per hectare (mol N/ha). Since 1990, nitrogen deposition has decreased by approximately 51…

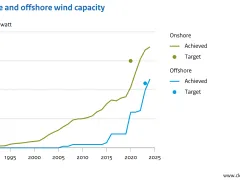
Wind energy capacity, 1990-2024

In 2024 Dutch wind energy capacity increased by more than 9 percent compared to 2023. The onshore wind capacity increased slightly by 2 percent in 2024, while the offshore capacity increased by 19…

Renewable energy use, 1990-2024

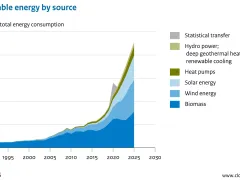
The share of renewable energy in total energy consumption was 19.8 percent in 2024. This is higher than in 2023, when the share reached 17.4 percent. Renewable energy consumption went from 312…

Ozone layer, 1980-2024

The thickness of the ozone layer has decreased several percent worldwide in the period 1980-1995. Since the mid 1990s, it has remained stable at this lower level.